1 SEGGER_SYSVIEW_PrintfHost(): its use, and bugs
1.2 Using SEGGER_SYSVIEW_PrintfHost()
1.2.1 Supported format-placeholder types, e.g., "%d", but not %s
1.3 Bugs in SEGGER_SYSVIEW_PrintfHost()
1.3.1 The User-Guide omits needed info
1.3.2 "%%" causes buffer-overflow
1.3.3 "%c" with 0x00 terminates the displayed output-string
1.3.4 "%s" use incorrectly described in a SystemView forum post
2 SystemView Recorder: primary windows, and timestamps
2.1 Timestamps in the three windows
3 Upgrading SystemView code, on the board
3.1 Upgrading the files in Middleware\Third_Party\SEGGER
3.2 Upgrading instances of SEGGER_SYSVIEW_Conf.h
4 SystemView troubleshooting: problems, and a bug
4.1 SystemView problem: Start-Recording hangs and does not start
4.2 SystemView problem: Recorder reports overflow
4.3 SystemView problem: session hangs
SystemView : its use, bugs, and troubleshooting
12/3/2021
This document provides info for using SystemView, with the book. The following sections are:
● SEGGER_SYSVIEW_PrintfHost(): its use, and bugs
● SystemView Recorder: primary windows, and timestamps
● Upgrading the SystemView code, on the board
● SystemView troubleshooting: problems, and a bug
Document versions
● 10/18/2021 : initial version
● 11/2/2021 : added sections "SEGGER_SYSVIEW_PrintfHost()" and "Upgrading the SystemView code"
● 12/3/2021: added section "SystemView problem: Recorder reports overflow"
1 SEGGER_SYSVIEW_PrintfHost(): its use, and bugs
This section provides info needed to use SEGGER_SYSVIEW_PrintfHost(). This info is omitted in the SystemView User Guide, which is where the function is documented. Also, the function has some bugs that are likely to affect users, and they are described here.
1.1 Overview and terminology
SEGGER_SYSVIEW_PrintfHost() is a SystemView API that runs on the board. It generates a message that is displayed on the SystemView app, e.g., in the Terminal window. For brevity, the function will be referred to as S...PrintfHost().
The info provided here is based on: the SystemView Target-Sources version 3.30 (the current version as of 10/2021), the SystemView User Guide version 3.20, and the SystemView Windows-app version 3.30. The book's system uses Target-Sources version 2.52h. Its S...PrintfHost() function appears to work the same way and have the same problems as in version 3.20.
S...PrintfHost() is modeled after printf(). However, there are significant differences between them.
This is an example of a call to S...PrintfHost():
int x = 15;
unsigned long y = 0xffffffff;
int * z = (int *) 0xffffffff;
SEGGER_SYSVIEW_PrintfHost("x:%d y:%u z:%p", x, y, (void *)z);
This is the output-string, displayed in the SystemView app, in its Terminal window:
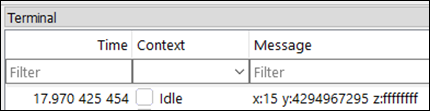
As with printf(), the arguments for S...PrintfHost()are: a format-string, followed by format-specifiers. The format-string can contain format-placeholders, which start with a "%" character. For each format-placeholder there is a corresponding format-specifier argument. The function's output is a formatted-string, and it will be referred to as the output-string.
The syntax and terminology for format-placeholders is shown below for printf(). For S...PrintfHost(), the syntax for its format-placeholders is not specified, but presumably it is similar.
%[parameter][flags][width][.precision][length]type
When S...PrintfHost() is called, it puts its arguments into a packet, and it sends the packet to the SystemView app on the host. The app uses the packet to create the output-string, and the app displays the output-string, e.g., in the Terminal window.
1.2 Using SEGGER_SYSVIEW_PrintfHost()
The SystemView User Guide omits info needed to use SEGGER_SYSVIEW_PrintfHost(). Some key parts of that omitted info are provided here. Not all of the omitted info is provided here, e.g., for format-placeholders, only the type field (e.g., "%d") is described here.
1.2.1 Supported format-placeholder types, e.g., "%d", but not %s
S...PrintfHost() only supports some format-placeholder types, e.g., %d, but not %s. The User Guide does not specify which ones are supported.
From testing, the supported types are listed below. There may be others.
● c : Character
● d : Signed decimal integer
● p : Pointer address
● u : Unsigned decimal integer
● x : Unsigned hexadecimal integer
● % : A % followed by another % character will write a single % to the output-string.
From testing, the types that are not supported are listed below. There may be others.
● f : Decimal floating point, lowercase
● F: Decimal floating point, uppercase (from static analysis, not tested)
● s : String of characters
1.2.2 Omitted error-checking
S...PrintfHost() doesn't provide syntax checking for its arguments. Also, the SystemView app doesn't appear to provide much syntax or error checking for the arguments it receives from S...PrintfHost(). A consequence is that when using S...PrintfHost() incorrectly, the S...PrintfHost() call will typically compile and run, but the SystemView app may display no data or incorrect data, or the app may crash. (In contrast, GCC's printf() will detect many errors at compile time.)
For example, "%f" and "%s" are not supported, but S...PrintfHost() does not indicate this when compiled and run. When "%f" or "%s" are specified, only part of the provided data is sent by S...PrintfHost() to the SystemView app. It's not clear what the app does to process "%f" and "%s". The app may just ignore the format-placeholder, or it may attempt to format the data provided, even though only part of it is provided. For example, with %s, the app sometimes displays a few random characters for the string, but it usually displays nothing.
When S...PrintfHost() is used incorrectly, the SystemView app may display incorrect data. These are some examples:
● If "%f %d" is specified, the "%d" will display the data in the floating-point argument's second 4-bytes (for an 8-byte floating-point argument). (No indication is given that "%f" is not supported.)
● If "%d" is specified, and the argument provided for it is an unsigned int, an incorrect value may be displayed. (With GCC's printf(), a warning message is issued for such data-type mismatches.)
● If an argument is not provided for a format-placeholder (e.g., "%c"), then bogus argument-data is used, from the call-stack. (With GCC's printf(), a warning message is issued for such argument mismatches.)
1.3 Bugs in SEGGER_SYSVIEW_PrintfHost()
This section describes three known bugs in S...PrintfHost(). The work-arounds are obvious, so they are not described.
For context, S...PrintfHost() is implemented in SEGGER_SYSVIEW.c. Most of the processing for S...PrintfHost()is done by the function _VPrintHost().
1.3.1 The User-Guide omits needed info
● Bug: The SystemView User Guide omits info needed to use SEGGER_SYSVIEW_PrintfHost().
The User Guide has a very short section on S...PrintfHost(). As described earlier, the User Guide does not specify what format-placeholders are supported. Also, it doesn't specify how errors in argument-use are detected and processed. These omissions imply that the function works the same as printf(), but this is misleading, as there are significant differences with printf().
The User Guide describes S...PrintfHost()'s arguments in one sentence, but it is unclear. It states, "All
format arguments are treated as 32-bit scalar values." ("Format
arguments" is another term for format-specifier arguments.)
However, "treated as" is vague. It does not adequately describe
what argument-types can be used, and how the arguments are processed and used.
For example, float-type
variables are 4 bytes and scalar, but they are not supported. float-type arguments
are expanded to 8 bytes when pushed on the call-stack. Internally, S...PrintfHost() is
only able to correctly-process arguments that are 4-bytes on the call-stack. In
contrast, char-type
variables are 1 byte and scalar, and they are supported. They are expanded to
4 bytes when pushed on the call-stack.
1.3.2 "%%" causes buffer-overflow
● Bug: In the format-string, a pair of "%" characters (i.e., "%%") causes a buffer-overflow
In a format-string, "%%" is used to put a "%" in the output-string. "%%" does not correspond to any format-specifier arguments. Both S...PrintfHost() and printf() work like this.
Each "%%" specified causes an 8-byte buffer-overflow. The maximum buffer-overflow is 64 bytes. The buffer-overflow can be benign, or it can cause the SystemView app to crash.
Problem analysis:
_VPrintHost() parses the format-string to find "%" characters. For each "%" found, va_arg() is called to get a format-specifier (an argument). Four bytes are returned for each va_arg() call, and the four bytes are put in a buffer (aParas[]).
The problem is that _VPrintHost() interprets "%%" as
specifying two format-specifiers (two arguments). va_arg() gets called twice for
"%%", but va_arg()
should not be called at all for them.
For each "%%" pair, va_arg()will be called for two
arguments that do not exist. va_arg()
does not specify how it works when called for a non-existent argument.
Presumably it results in an out-of-bounds access in the stack. (More info is at
this link:)
For each "%%" pair, the buffer aParas[] gets overflowed by 8 bytes. aParas[] is a local variable, so it's on the stack.
On most systems, the largest buffer-overflow possible is 64 bytes. By default, _VPrintHost() cannot make more than 16 calls to va_arg(). (The limit is specified by SEGGER_SYSVIEW_MAX_ARGUMENTS.). So, a format-string with eight "%%" pairs will result in a 64-byte overflow (16 * 4 bytes).
An overflow of 64 bytes will likely overwrite something important on the stack. In the code below, the format-string has 8 eight "%%" pairs. So it creates an overflow of 64 bytes. In running the code, the SystemView app crashed on the Windows host.
char ca = 'a';
SEGGER_SYSVIEW_PrintfHost("%%%%%%%%%%%%%%%%12%c345678", ca);
From testing, specifying "%%" in a format string doesn't always cause failure. For example, this call seemed to work OK:
SEGGER_SYSVIEW_PrintfHost("%%12c345678");
1.3.3 "%c" with 0x00 terminates the displayed output-string
● Bug: using "%c" with 0x00 terminates the displayed output-string
There is a bug in the SystemView app, in how it displays the output-string from a call to S...PrintfHost(). The bug occurs when an output-string has a binary-zero prior to the string's final null-terminator. The first binary-zero is incorrectly interpreted as the output-string's final null-terminator, and the rest of the string is not displayed.
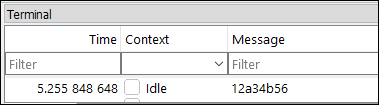
For S...PrintfHost(),"%c" is used to specify a single byte for the output-string. The following code uses "%c" three times:
char ca = 'a'; char cb = 'b'; char c0 = 0;
SEGGER_SYSVIEW_PrintfHost("12%c34%c56%c78", ca, cb, c0);
The output-string should be: 12a34b56\078\0. "\0" is binary zero (0x00). The first "\0" is from the third "%c", and the second "\0" is the output-string's final null-terminator.
When the output-string is displayed in the SystemView app, only the characters prior to the first "\0" are displayed. Output for the above code is shown below. The first binary-zero is incorrectly interpreted as the output-string's final null-terminator, and the rest of the string is not displayed.
The Terminal window:
The Events List window:

In displaying the output-string, stopping at a binary-zero before the final null-terminator is a bug, in our assessment. The reason is that printf() does not do that on canonical systems, e.g., Ubuntu's terminal. Instead, the whole output-string is displayed, up to, but not including, the final null-terminator. Non-printable characters are not displayed (e.g., 0x00).
The following call to printf()uses the same arguments that were used above with S...PrintfHost():
char ca = 'a'; char cb = 'b'; char c0 = 0;
printf("12%c34%c56%c78", ca, cb, c0);
The output on a Ubuntu terminal is below. It displays the output-string's last two characters ("78"), whereas the SystemView app doesn't.
![]()
The bug could be fixed by altering SystemView to display the output-string the same way printf() does on a Ubuntu terminal. An alternative fix is to update the SystemView Users Guide to specify that output-strings are not displayed after the first binary zero.
1.3.4 "%s" use incorrectly described in a SystemView forum post
● Bug: In Segger's forum on SystemView, there is a post on how to use "%s", but it is incorrect.
The post is here:
https://forum.segger.com/index.php/Thread/7832-SOLVED-SystemView-fail-to-print-s/?postID=28792
The post says S...PrintfHost() can use the "%s" format-placeholder if the following config-macro is specified. The config-macro is for the SystemView Target-Sources.
#define SEGGER_SYSVIEW_PRINTF_IMPLICIT_FORMAT 1
I'm pretty sure this config-macro doesn't result in the "%s" format-placeholders being processed:
● It didn't work when I tried it with the SystemView Target Sources versions 2.52h and 3.30.
● I looked at the related Target Sources source-code, and it appears that the "%s" format-placeholders are not formatted anywhere.
● I could not find any SystemView documentation on using that config-macro, e.g., it's not in the User Guide, nor is it described in the Target-Sources source-code.
Problem analysis:
The config-macro's default is 0, and it is defined in SEGGER_SYSVIEW_ConfDefaults.h. The default can be over-ridden by setting the config-macro to 1 in SEGGER_SYSVIEW_Conf.h.
The config-macro is referenced in the Target-Sources file SEGGER_SYSVIEW.c. It is used in these functions: _VPrintHost() and _VPrintTarget().
When S...PrintfHost() is called using "%s", it normally sends the arguments to the SystemView app. This processing is done by _VPrintHost(). Setting that config-macro to 1 causes the arguments to be formatted on the board instead. That processing is done by _VPrintTarget(). However, _VPrintTarget() has no code for processing "%s".
2 SystemView Recorder: primary windows, and timestamps
This section describes the SystemView Recorder:
● The three primary windows: Events List, Terminal and Timeline.
● The timestamps used in those windows
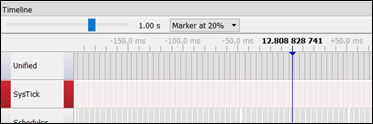
The three primary windows are identified in the screenshot below.

2.1 Timestamps in the three windows
● Where timestamps are displayed:
o The "Events List" and Terminal windows, in a column
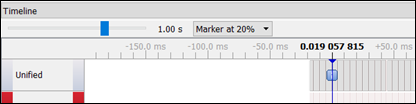
o The Timeline window: at the "marker". The marker is the blue vertical line
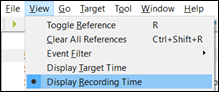
● There are three types of timestamp formats:
o "Target time" and "recording time" formats can be selected via the "View" menu:
o The "reference" time-format is selected via the "R" key. It is described in the SystemView User Guide.
● The timestamp-formats used in each window
o The Events List and Terminal windows always use the same timestamp format (whichever one has been selected in the "View" menu)
o The Timeline window's timestamp-format is always "recording time".
● "Recording time" is relative to the first recorded event, which occurs at time 0. An example is below.
o Events List window:
o Timeline window:
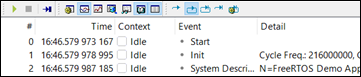
● "Target time" is presumably relative to a timer on the board. The first event typically occurs at a time greater than 0, e.g., "16:46.579 973 167". An example is below. It shows the same windows as above, but using the "target time" format.
o Events List window:
o Timeline window (the timestamp here is always in "recording time"):
● How timestamps are synchronized between the three windows
o The Timeline window's timestamp is always shown in the Event List. So, if the Timeline window is scrolled, the Event List window is scrolled.
o However, when the Timeline window is scrolled, the Terminal window is not necessarily scrolled. So, the Terminal window can show a different time-frame than the Timeline and Events Lists windows.
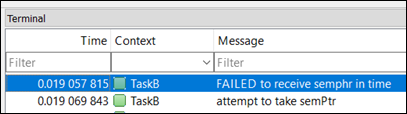
2.2 The Terminal window
● The Terminal window lists messages from the running program, generated with SEGGER_SYSVIEW_PrintfHost().
● Clicking on a line (event) in the Terminal window will cause the same event to be shown in the other two windows.
● The event shown in the other two windows is labeled by a blue rectangular icon with the letter "i"
o Terminal window:
o Events List window:
o Timeline window:
2.3 Events List window
● Clicking on an event, in the Events List window
o In the Timeline window, moves the window so that the marker is at the event's timestamp
o In the Terminal window, if the event clicked-on is a message, the window is moved to show that event. If the event-clicked-on is not a message, the window is not moved.
● Explanation of the Context column's color-scheme
o In the Context column, each row has a colored box and a task name
o The SystemView user-guide does not appear to describe the boxes' coloring-scheme. This is what it appears to be:
■ The two types of box colors are: one solid color, or two colors
■ A solid-colored box indicates that only the named-task is running at the timestamp
■ Two colors indicates there is a transition from the task named in the prior row, to the task named in the current row
o Examples of the boxes' color-scheme, for the two figures below:
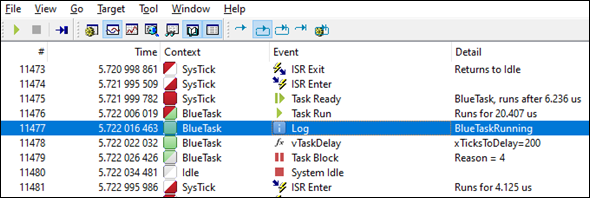
■ In the Event List, event #11477 was clicked on, and its row is highlighted
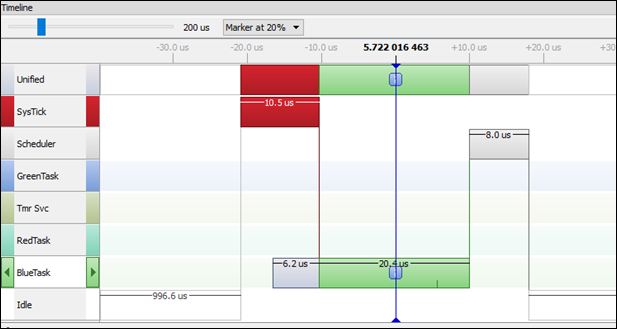
● In the Timeline, that event is indicated by the vertical blue line.
■ In the Event List:
● At event #11477, only the BlueTask task is running, so the Context column's box is solid green. In the Timeline, the BlueTask task is also colored green.
● At event #11475, only the SysTick task is running, so the Context column's box is solid red. In the Timeline, the SysTick task is also colored red.
● At event #11467, there is a transition from the SysTick task to the BlueTask task, so the Context column's box uses two colors, red and green.
■ Events List window:
■ Timeline window:
2.4 Timeline window
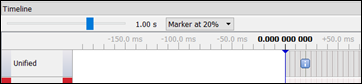
● Controls and features in the Timeline window:
o Upper-left slider: sets the zoom level, which can also be set by right-clicking on the timeline
■ The zoom-level is the time-period shown in the timeline window, e.g., 1 second
o Marker: The dark vertical line with a timestamp
o "Marker at X%" drop-down box: sets the Marker's relative position in the timeline window.
■ For example, if the window's time-period is 1 second, setting the marker to 20% will cause the timeline-window to start at .2 seconds before the marker's timestamp.
● Clicking on a line (event) in the Event or Terminal windows:
o Moves the Timeline window so that the marker is at that event's timestamp
● Double-clicking on the timeline:
o For the clicked-upon time, selects the event whose timestamp is exactly at the spot clicked, or just before the spot clicked
o In the Timeline window, moves the window so that the marker is at the selected event's timestamp
o In the Events List window, moves the window to show that event, and highlights the event if the window is scrolled
o In the Terminal window, moves the window to show that event if the selected event is a message. If the selected event is not a message, the window is not moved.
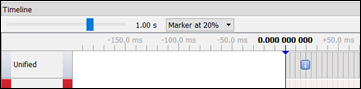
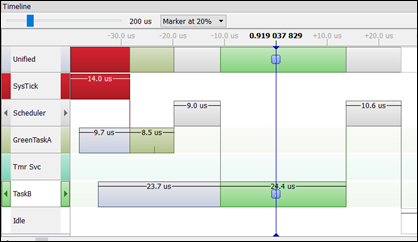
● Tasks which are marked ready for execution are displayed with a light grey bar until their execution starts. This is shown in the figure below.
● Example Timeline window, shown below
o The zoom-level was set to 200us
o In the Terminal window, a line (event) was clicked.
o In the Timeline window, the window is moved so that marker is at the clicked event's timestamp.
3 Upgrading SystemView code, on the board
This section describes how to update the SystemView code that runs on the board. It's a non-trivial process. It's probably not needed for running the book's code. However, the upgrade can be an instructive exercise.
SystemView provides code that runs on the board and communicates with the SystemView app on the host-computer. The code that runs on the board is provided in source-code format, and it is called the SystemView Target Sources. (For brevity, they will be referred to as the Target Sources.)
For the system distributed with the book, the Target Sources are already installed (version 2.52h). The FreeRTOS Kernel is also already installed (version 10.2.1), in source-code format. For the book's example-programs, the build-system is configured to compile FreeRTOS and the Target Sources.
The upgrade process described here is for upgrading from Target-Sources version 2.52h, to version 3.30 (the current version as of 10/2021). This process involves replacing the Target-Sources files. It does not require modifying the build-configuration. A Windows host is used.
Segger provides instructions for installing the Target Sources with FreeRTOS. In the book's system, the Target Sources are installed in a slightly different way. Segger's instructions were not used here, as it would probably require changing the build-system configurations. Also, Segger's instructions may not be current, e.g., it uses traceSTART(), which appears to be deprecated.
● https://wiki.segger.com/FreeRTOS_with_SystemView
In the upgrade process described here, the file-paths shown are for my host. Your file-paths may be different.
The Target-Sources can be downloaded here: https://www.segger.com/downloads/systemview/
On my host, the downloaded Target-Sources are in the folder: D:\...\SystemView_Src_V330
Also on my host, the system distributed with the book is at: C:\projects\packtBookRTOS.
It's prudent to back-up that folder before making this upgrade.
In the book's system, almost all of the Target-Source's files are at this directory:
C:\projects\packtBookRTOS\Middleware\Third_Party\SEGGER
How to upgrade those files is described in a section below.
SEGGER_SYSVIEW_Conf.h is a config file, distributed in the Target Sources. There is an instance of it in each chapter-folder, in the Inc sub-folder, e.g.,
C:\projects\packtBookRTOS\Chapter_10\Inc\SEGGER_SYSVIEW_Conf.h
How to upgrade those instances is described in a section below.
Upgrading the SystemView Target Sources just involves making the file upgrades described these next two sections.
3.1 Upgrading the files in Middleware\Third_Party\SEGGER
The old Target-Sources files were at:
C:\projects\packtBookRTOS\Middleware\Third_Party\SEGGER
The new Target-Source files were downloaded to:
D:\...\SystemView_Src_V330
For the downloaded files that are specified below, copy and paste them, to replace the old files at:
C:\projects\packtBookRTOS\Middleware\Third_Party\SEGGER
● From SystemView_Src_V330\SEGGER\
SEGGER_SYSVIEW_Int.h
SEGGER_SYSVIEW_ConfDefaults.h
SEGGER_SYSVIEW.h
SEGGER_SYSVIEW.c
SEGGER_RTT_printf.c
SEGGER_RTT_ASM_ARMv7M.S
SEGGER_RTT.h
SEGGER_RTT.c
SEGGER.h
● From SystemView_Src_V330\SEGGER\Syscalls\
SEGGER_RTT_Syscalls_SES.c
SEGGER_RTT_Syscalls_KEIL.c
SEGGER_RTT_Syscalls_IAR.c
SEGGER_RTT_Syscalls_GCC.c
● From: SystemView_Src_V330\Sample\FreeRTOSV10\
SEGGER_SYSVIEW_FreeRTOS.h
SEGGER_SYSVIEW_FreeRTOS.c
● From: SystemView_Src_V330\Sample\FreeRTOSV10\Config\Cortex-M\
SEGGER_SYSVIEW_Config_FreeRTOS.c
● From: SystemView_Src_V330\Config\
SEGGER_RTT_Conf.h
Global.h
3.2 Upgrading instances of SEGGER_SYSVIEW_Conf.h
For the book's system, each chapter-folder has a SystemView config-file, SEGGER_SYSVIEW_Conf.h It is in the Inc sub-folder, e.g., for Chapter 10:
C:\projects\packtBookRTOS\Chapter_10\Inc\SEGGER_SYSVIEW_Conf.h
It appears that those config-files were copied from the SEGGER_SYSVIEW_Conf.h file in the Target-Sources version 2.52h. And, the following macro definition was added to each config-file. However, the macro's value differs among the config-files.
#define SEGGER_SYSVIEW_RTT_BUFFER_SIZE 10240
To upgrade the config-files:
For each config-file in the chapter-folders, use a diff to identify changes relative to the file provided in the Target Sources version 2.52h. This requires downloading Target-Sources version 2.52h.
For each chapter-folder, replace the existing config-file with the upgraded config-file from
● SystemView_Src_V330\Config\SEGGER_SYSVIEW_Conf.h
And, in each upgraded config-file, add any changes found via the diff, including the macro shown above.
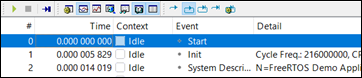
4 SystemView troubleshooting: problems, and a bug
This section describes two problems encountered in using SystemView, and a SystemView bug. Also included is the console output from a successful start-up of the SystemView Recorder. In diagnosing SystemView start-up problems, that console output can be useful for comparison.
4.1 SystemView problem: Start-Recording hangs and does not start
● Problem
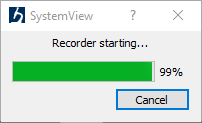
o After clicking on "Start Recording", SystemView hangs and does not start
o Messages include:
■ "Recorder starting..." hangs at 99%
■ "Communication timed out":
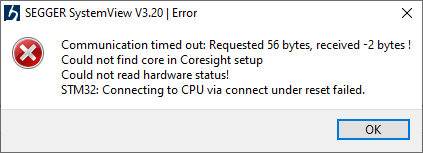
● Solution
o When this problem occurs, SystemView may get stuck in a loop, where it continually tries to connect. Getting out of this loop will probably require shutting-down SystemView.
o A likely cause of the problem is with Ozone, and its .jdebug file not having the line:
■ Project.SetRTT(0);
o The study-guide's Cheat-Sheet has more info on running Ozone and SystemView.
4.2 SystemView problem: Recorder reports overflow
● Problem:
o When the SystemView Recorder is run, it may report overflow. With overflow, some events are not sent to the SystemView app on the host.
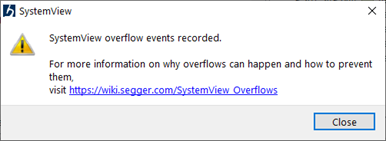
■ Pop-up message: "SystemView overflow events recorded"
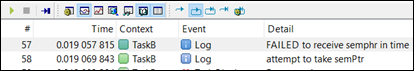
■ The Events List window shows where overflow occurs, and its extent.
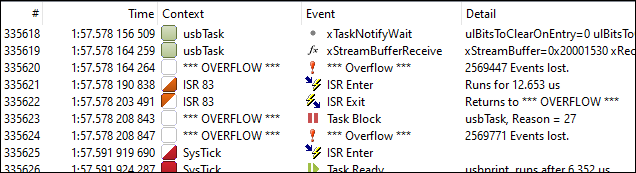
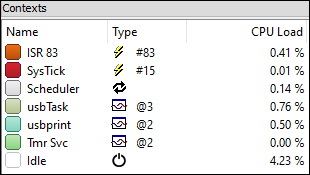
o Overflow can cause SystemView calculations to be incorrect
■ For example, I suspect CPU usage was less than %100 for this test, due to overflow:
● Solution #1: Segger's info on fixing overflow
o Wiki
■ Note: does not provide much info
■ https://wiki.segger.com/SystemView_Overflows
o SystemView User Guide
■ "Overflow events occur when the SystemView RTT buffer is full. This can happen for following reasons:
● J-Link is kept busy by a debugger and cannot read the data fast enough.
● The target interface speed is too low to read the data fast enough.
● The application generates too many events to fit into the buffer.
■ To prevent this:
· Minimize the interactions of the debugger with J-Link while the target is running. (e.g. disable live watches)
· Select a higher interface speed in all instances connected to J-Link. (e.g. the debugger and SystemView)
· Choose a larger buffer for SystemView. (1 - 4 kByte)
· Run SystemView stand-alone without a debugger. "
● Solution #2: fixes that might be effective with the book's example programs
o Run SystemView Recorder without the Ozone debugger
■ Use Ozone to load the program and start it. Then, stop the debugger before starting SystemView Recorder
o Reduce the number of calls to SEGGER_SYSVIEW_PrintfHost().
o Set a larger RTT buffer-size, in SEGGER_SYSVIEW_Conf.h.
■ Values that might work are: 10000 and 32000
#define SEGGER_SYSVIEW_RTT_BUFFER_SIZE 6144
4.3 SystemView problem: session hangs
● Problem:
o SystemView hung once, after running for 14 minutes.
o The problem may be due to using an incorrect "Target Interface Speed" (frequency), in the SystemView configuration.
● Solution:
o More info is in the study-guide's web page for Chapters 4-6, under the list-item:
■ "Bug in book (possible bug), page 144"
4.4 SystemView bug: does not open or exit properly
● Problem:
o It appears there are situations in which SystemView does not exit properly, and
o This can cause problems such as:
■ SystemView cannot be closed
■ SystemView cannot be opened
■ When starting an Ozone debug-session, Ozone may hang and the debug-session does not fully start.
● Solution:
o Disconnect the USB cable for the board
o Open Task Manager and end these tasks, if present:
■ SystemView
■ JLinkGUIServer.exe
● Problem details:
o When this problem has occurred, it appeared to be when closing SystemView after encountering problems, such as hanging, or failing to connect.
4.5 Console output for a successful recorder start-up
If SystemView's Recorder does not start successfully, this section can be used as a reference, for troubleshooting.
● From the book's Chapter 6, in the section "Using SystemView" (page 144)
11:27:16 - SEGGER SystemView V3.20 started @ 25. Jan 2021 11:27:16
11:27:16 - Loading C:/Program Files/SEGGER/SystemView/Sample/OS_IP_WebServer.SVDat
11:27:16 - TRACE START Event recorded.
11:27:21 - JLink: Device "STM32F767ZI" selected.
11:27:21 - JLink: Found SW-DP with ID 0x9BA02477
11:27:21 - JLink: Found SW-DP with ID 0x9BA02477
11:27:21 - JLink: DPv0 detected
11:27:21 - JLink: Scanning AP map to find all available APs
11:27:21 - JLink: AP[1]: Stopped AP scan as end of AP map has been reached
11:27:21 - JLink: AP[0]: AHB-AP (IDR: 0x74770001)
11:27:21 - JLink: Iterating through AP map to find AHB-AP to use
11:27:21 - JLink: AP[0]: Core found
11:27:21 - JLink: AP[0]: AHB-AP ROM base: 0xE00FD000
11:27:21 - JLink: CPUID register: 0x411FC270. Implementer code: 0x41 (ARM)
11:27:21 - JLink: Found Cortex-M7 r1p0, Little endian.
11:27:21 - JLink: FPUnit: 8 code (BP) slots and 0 literal slots
11:27:21 - JLink: CoreSight components:
11:27:21 - JLink: ROMTbl[0] @ E00FD000
11:27:21 - JLink: ROMTbl[0][0]: E00FE000, CID: B105100D, PID: 000BB4C8 ROM Table
11:27:21 - JLink: ROMTbl[1] @ E00FE000
11:27:21 - JLink: ROMTbl[1][0]: E00FF000, CID: B105100D, PID: 000BB4C7 ROM Table
11:27:22 - JLink: ROMTbl[2] @ E00FF000
11:27:22 - JLink: ROMTbl[2][0]: E000E000, CID: B105E00D, PID: 000BB00C SCS-M7
11:27:22 - JLink: ROMTbl[2][1]: E0001000, CID: B105E00D, PID: 000BB002 DWT
11:27:22 - JLink: ROMTbl[2][2]: E0002000, CID: B105E00D, PID: 000BB00E FPB-M7
11:27:22 - JLink: ROMTbl[2][3]: E0000000, CID: B105E00D, PID: 000BB001 ITM
11:27:22 - JLink: ROMTbl[1][1]: E0041000, CID: B105900D, PID: 001BB975 ETM-M7
11:27:22 - JLink: ROMTbl[0][1]: E0040000, CID: B105900D, PID: 000BB9A9 TPIU-M7
11:27:22 - JLink: Cache: Separate I- and D-cache.
11:27:22 - JLink: I-Cache L1: 16 KB, 256 Sets, 32 Bytes/Line, 2-Way
11:27:22 - JLink: D-Cache L1: 16 KB, 128 Sets, 32 Bytes/Line, 4-Way
11:27:28 - TRACE START Event recorded.
(c) Jim Yuill 2021, with MIT License